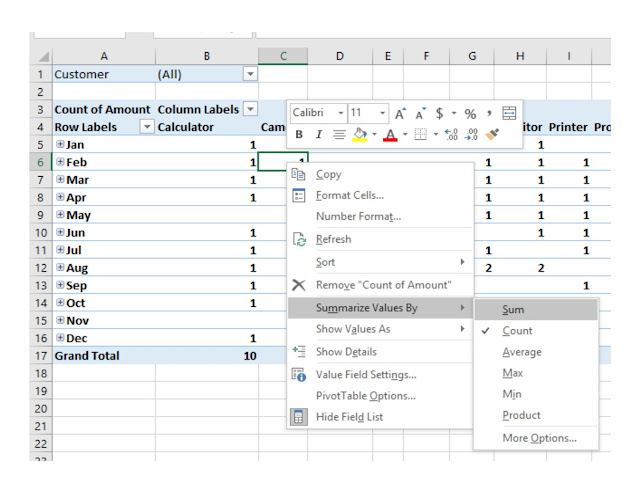
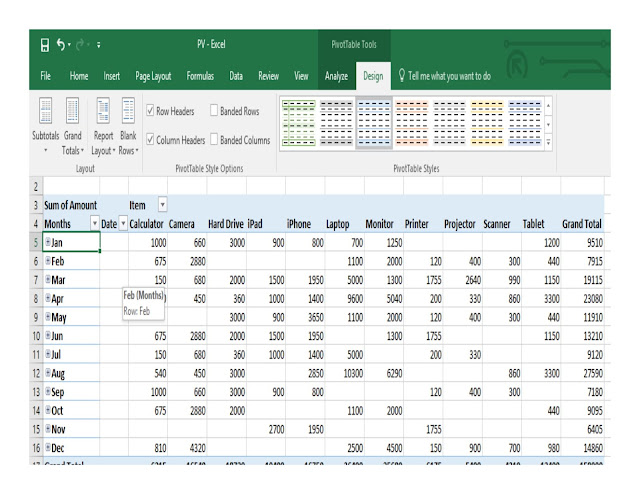
When creating a pivot table, Excel will automatically sum or count the items. If all the cells in a column contain numeric data, Excel chooses to sum. However, if one cell is either blank or contains text, Excel will choose to count.
To overwrite the default:

Right click any cell of the column that need to be changed, from the drop-down list, choose "Summarize Values By", from the fly-out menu click "Sum", then the pivot table will sum the items as follows:
Replacing Blanks with Zero
By default, pivot table will leave empty cells blank. To avoid values columns been treated as text just because of one blank cell, we can replace the blank cells with zeros:
Right click any cell of that specific column, choose Pivot Table Options:
A "Pivot Table Options" window will be activated:
In the pop up window, under Layout and Format tab, go to Format, type "0" into the box next to the field "For empty cells show".
Grand Totals
The default in Pivot Table is to show "Grand Total" for both rows and columns:
If user just want Grand Total rows, but not Grand Total columns, that can be done as follows:
Go to Design tab => Select Grand Totals =>Select "On For Rows Only" from the drop-down list
The drop-down list offers 4 choices, users can also choose "On for Columns Only", or on and off for both.
Subtotals
There are times users need to suppress the subtotals. To do so, user can go to Design tab, then
click Subtotals, from the drop-down list, select Do Not Show Subtotals.
However, this action will turn off all Subtotals. If user only want to suppress subtotals for particular column(s), then place the cursor in any cell of that particular column, go to Analyze tab, select Field Settings
Field Settings dialog box will then pop up:
Change the Subtotals setting from "Automatic" to "None" as above.
Compact Layout is the default Pivot Table report layout:
To change the Report Layout, go to Design tab, select Report Layout, from the drop-down list, select Show in Tabular Form:


No comments:
Post a Comment